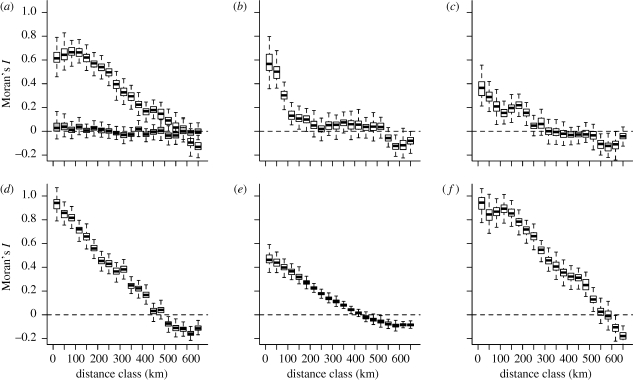
Figure 2.
Spatial autocorrelation for G and a number of environmental parameters. Shown is Moran's I for discrete distance classes (x-axis, in km). (a–c) Variables sampled at the level of individual lakes in set A. (a) Moran's I for G plus for the residuals of a regression predicting G from regional parameters (grey). (b) L-TP; (c) log(mean depth). (d) Air temperature (0.5 × 0.5 degree grid), (e) TP from a representative lake survey (set B) and (f) regionally averaged TP (=R-TP).

