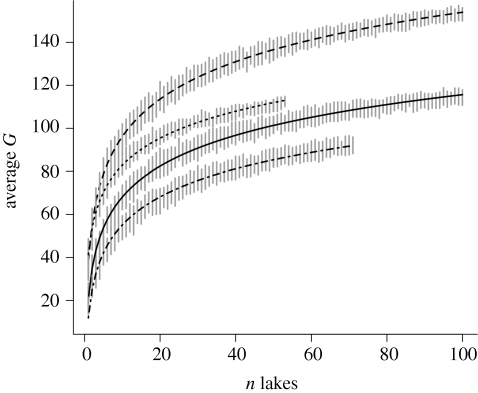
Figure 3.
Average number of genera (from ×50 resampling) found in a given number of lakes in four different regions in southern Fennoscandia (less than 63° north). Vertical bars give ×2 s.d. The curves were fitted to the model G = a + b × ln(n lakes). The analysis was constrained by the total number of lakes with phytoplankton data in the corresponding regions. Dashed line, south Finland; dotted line, south Sweden; solid line, southeast Norway; dashed dotted line, southwest Norway.

