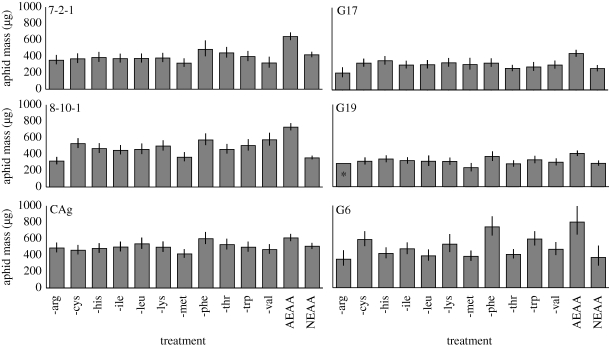
Figure 2.
Adult mass for selected clones on diets lacking individual EAAs. Clone names appear in the upper left of each graph. X-axis shows the amino acid omitted from the diet. Error bars represent 95% CI of the mean. The asterisk denotes that only a single aphid from G19 survived the duration of the experiment.

