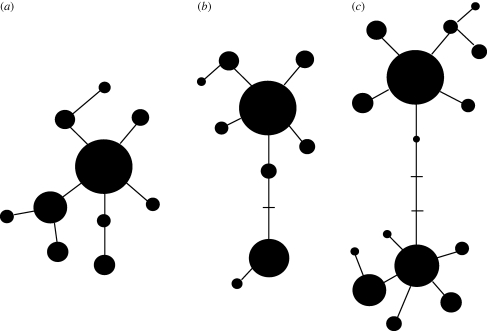
Figure 1.
Sketches of expected haplotype trees under (a) neutral evolution (b) recent positive selection (partial selective sweep) and (c) long-lasting balancing selection (on two distinct haplotypes). The haplotype trees show the relatedness between distinct haplotypes (black circles). The size of each circle represents the population frequency of the haplotype. The lines link the haplotypes assuming the lowest number of mutational steps. Missing intermediate haplotypes are represented by bars. The age of haplotypes can be inferred from the surrounding haplotype diversity (number of satellite haplotypes).

