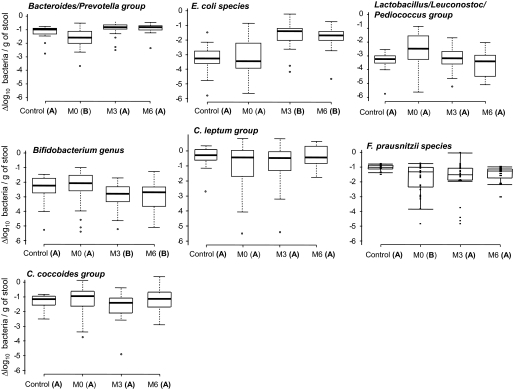
FIG. 1.
Quantifications of fecal microbiota in lean control subjects and obese subjects before (M0) and after surgery (M3 and M6). The qPCR results were plotted as boxes and whiskers graph. The boxes (containing 50% of all values) show the median (horizontal line across the middle of the box) and interquartile range, while the whiskers represent the 10th and 90th percentiles. The extreme data points are indicated as circles. Data not sharing the same letter in parentheses within a horizontal line are significantly different (P < 0.05).

