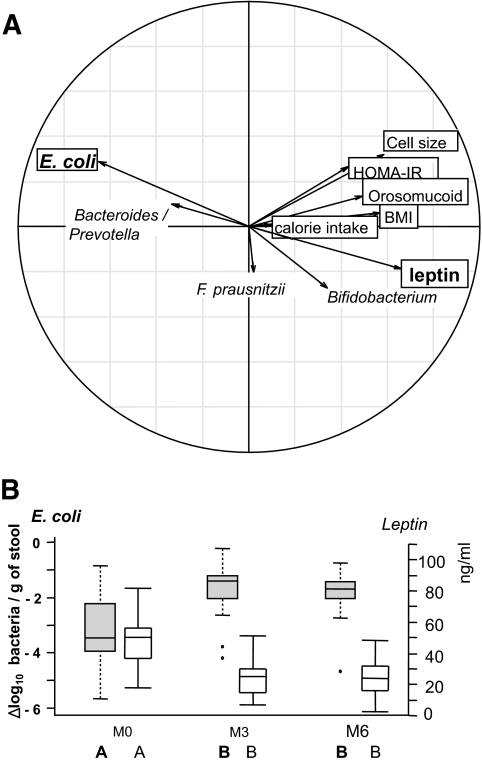
FIG. 2.
Relationship between changes in fecal microbiota composition and clinical parameters in obese patients following RYGB surgery. Real-time qPCR quantifications were used to determine the fecal microbiota composition for the bacterial groups indicated in supplementary Table 6. Clinical parameters included adipocyte cell size, BMI, calorie intake, HOMA-IR, leptin, and orosomucoid. A: Principal component analysis (between class analyses). Bold arrows indicate the marked inverse relationship between changes in E. coli population and leptin serum concentrations. B: Dynamics of E. coli population evolution and leptin concentration during the study. E. coli population levels are expressed as mean ± SEM of the Δlog10 value of normalized data calculated as the log number of targeted bacteria minus the log number of all bacteria. Leptin results were expressed as mean ± SEM of serum concentrations.

