FIG. 1.
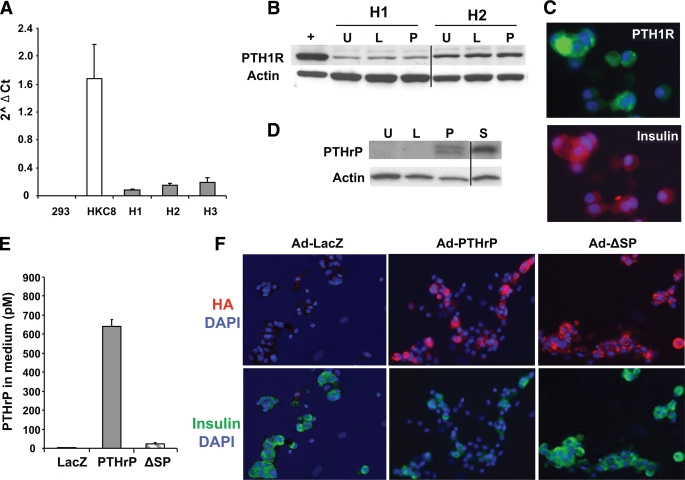
PTH1R and PTHrP expression in human islets. A: PTH1R mRNA expression measured by real-time PCR in three human islet preps (H1–H3); HKC8, a human kidney proximal tubule cell line, used as positive control; and the human embryonic kidney cell line 293, used as negative control. Quantitation is shown as log of Ct using actin as the housekeeping control gene. B: Western blot analysis of PTH1R and actin expression in a positive (+) control line (293 cells stably transfected with human PTH1R cDNA) and two human islet preps (H1 and H2) uninfected (U) or transduced with Ad-LacZ (L) or Ad-PTHrP (P). The line divides samples run on two different gels. C: Photomicrograph of human islet cell cultures costained for nuclear DAPI (blue), PTH1R (green), and insulin (red). D: Representative Western blot analysis of PTHrP and actin in human islets either uninfected (U) or transduced with Ad-LacZ (L), Ad-PTHrP (P), or Ad-ΔSP mutant (S). The line divides samples from different regions run on the same gel. E: Quantitation of PTHrP(1-36) by immunoradiometric assay in medium collected after 48 h of transduction of human islets with adenoviral constructs containing LacZ, PTHrP, or ΔSP sequences (n = 2 islet preparations). F: Representative images of human islet cell cultures transduced with Ad-LacZ, Ad-PTHrP, or Ad-ΔSP and costained for DAPI (blue), insulin (green), and HA (red). (A high-quality digital representation of this figure is available in the online issue.)

