FIG. 2.
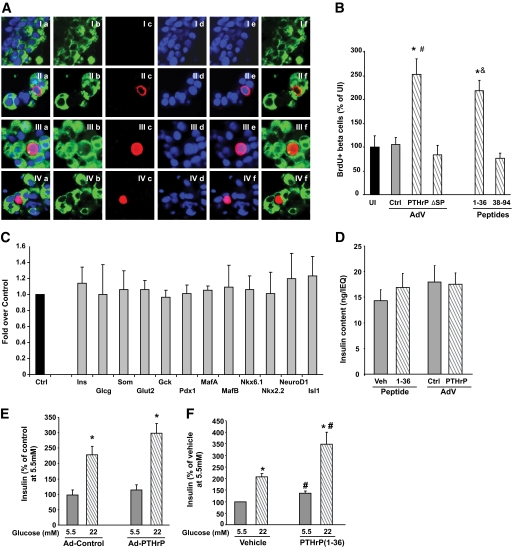
PTHrP increases human β-cell proliferation and function without causing dedifferentiation. A: Representative confocal images of human islet cell cultures transduced with Ad-control (I) or Ad-PTHrP (II–IV) and costained for insulin (green, panel b), BrdU (red, panel c), and DAPI (blue, panel d). The merged images of all three stainings are shown in panel a, merge for DAPI and BrdU in panel e, and merge for insulin and BrdU in panel f. B: Quantitation of the percentage of BrdU-positive β-cells from human islet cell cultures uninfected (UI) or transduced with the adenovirus (AdV) constructs control (ctrl), PTHrP, or ΔSP for 72 h or treated with 100 nmol/l of either 1-36 or 38-94 PTHrP peptides for 24 h. There was a significant two- to threefold increase in β-cell proliferation in PTHrP-transduced and 1-36–treated vs. Ad-control–transduced or uninfected control islet cells. Basal rate of β-cell proliferation in uninfected controls was 0.08 ± 0.03% (n = 4–11 individual human islet preps at least in duplicate). *P < 0.05 vs. uninfected or Ad-control by Student's t test; #P < 0.001 vs. Ad-control or Ad-ΔSP and &P < 0.01 vs. UI or 38-94 by one-way ANOVA. C: Expression of differentiation markers by real-time PCR from human islets treated for 24 h with vehicle control (Ctrl) or PTHrP(1-36) peptide (gray bars). PCR cycles for each gene were compared, with actin used as an internal control. The graph is depicted as fold over control, with values from vehicle-treated islets taken as 1 (n = 4–7 human islet preparations in duplicate). D: Insulin content per IEQ in extracts of human islets treated with vehicle (veh) or 100 nmol/l PTHrP(1-36) peptide or transduced with Ad-control (Ctrl) or Ad-PTHrP for 24 h (n = 5 human islet preparations in triplicate). E and F: Insulin secretion measured at 5.5 and 22 mmol/l glucose from human islets transduced with Ad-control or Ad-PTHrP for 24 h (E) and treated with vehicle or 100 nmol/l PTHrP(1-36) peptide for 30 min (F). Insulin secretion is depicted as percentage of vehicle-treated control at 5.5 mmol/l glucose, which was 455.4 ± 109.3 pg/μg protein in 30 min. n = 7–8 human islet preparations in triplicate. *P < 0.05 vs. insulin secretion at 5.5 mmol/l glucose with the same treatment; #P < 0.05 vs. insulin secretion at equivalent glucose concentrations of control. (A high-quality digital representation of this figure is available in the online issue.)

