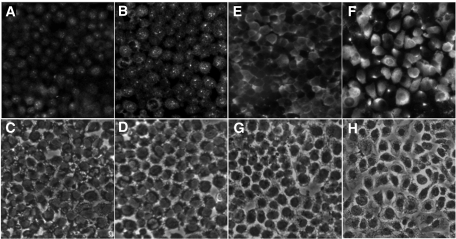
FIG. 3.
Representative images of LOX immunostaining in RRECs grown in normal (N) (A) and HG (B) conditions. C and D represent the corresponding brightfield images. Upregulation of LOX under HG shows predominantly focal cytoplasmic staining. Immunostaining of proLOX in RRECs in normal (E) and HG (F) conditions. G and H represent the corresponding brightfield images. Upregulation of proLOX under HG shows diffuse perinuclear distribution of proLOX.

