
Figure 9.
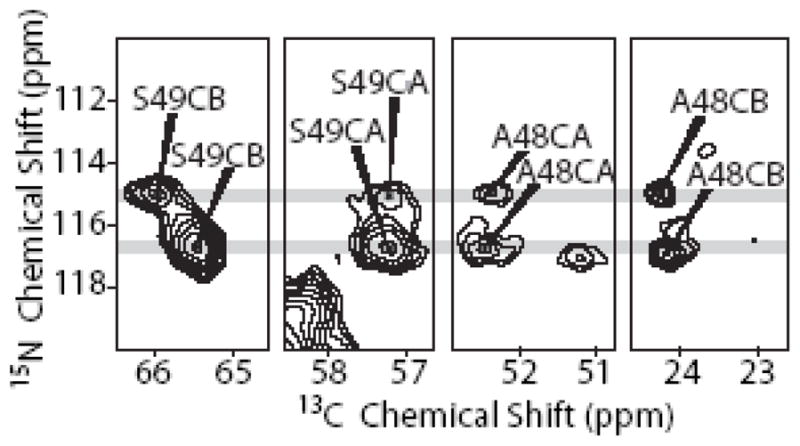
Correlations of S49 CA and CB and A48 CA and CB with two distinct S49 amide 15N signals (grey lines). The two left panels are from a NCACX spectrum acquired at 700 MHz, while the two right panels are from a NCOCX spectrum acquired at 900 MHz.