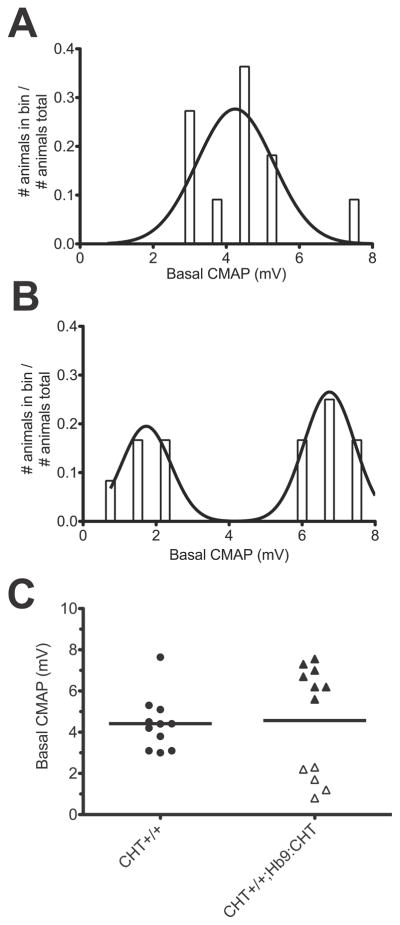
Fig. 4.
CMAP analysis of the hindlimb paw muscles: (A) Maximal stimulated recorded compound muscle action potential (CMAP) prior to high frequency stimulation (CHT+/+ n=11, CHT+/+Hb9:CHT n=12). Histogram of CMAP amplitudes for CHT+/+ (B) and CHT+/+;Hb9:CHT (C) mice and the resulting probability density functions.

