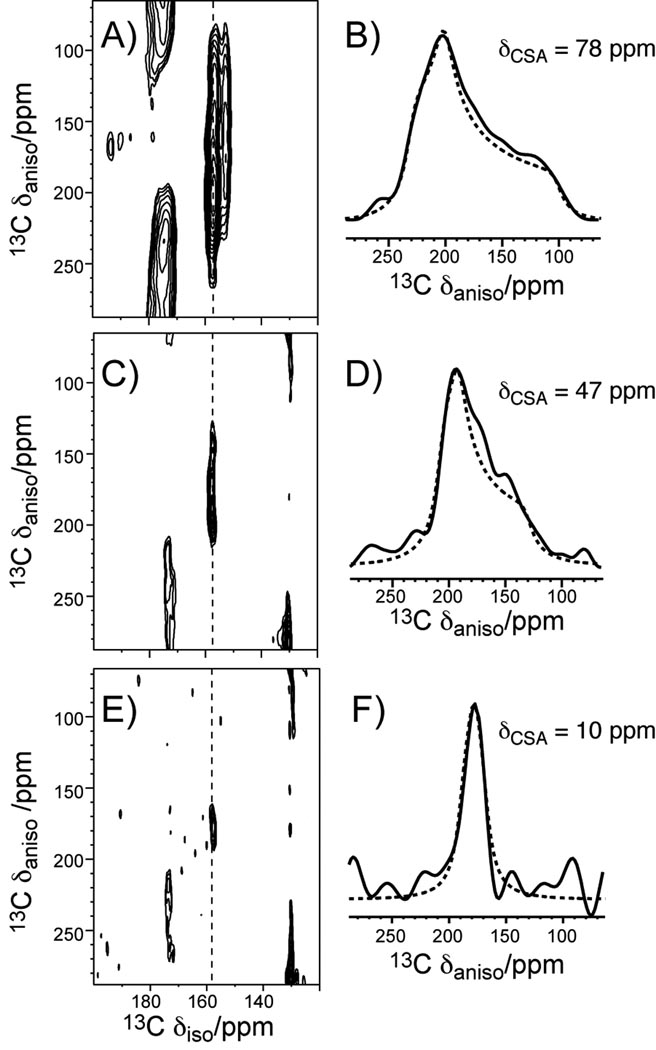
Figure 3.
Arg Cζ chemical shift anisotropies from the SUPER experiment. The 2D SUPER spectra are shown in A), C), E) and the corresponding Cζ 1D cross sections are shown in B), D), F). A, B) Fmoc-Arg(MTR)-OH. C, D) PG-1 Arg4. E, F) PG-1 Arg11. The PG-1 data were measured at 283 K in the POPE/POPG membrane.

