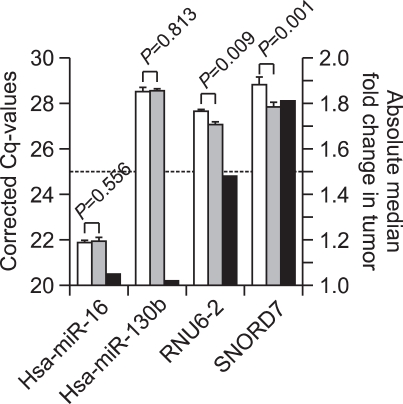
Figure 1.
Expression of reference gene candidates measured in RNA pools obtained from matched non-malignant and malignant prostate cancer tissue specimens. For each pool, RNA extracts were diluted to the same concentration and then equal volumes were mixed to obtain the same final concentration in the RNA pools (250 ng/µl) from malignant and non-malignant samples, respectively. The first two columns of every gene represent the expression values as mean Cq-values ± 1 SD (n = 3; blank, non-malignant tissue; grey, malignant tissue) related to the left y-axis scale. The third column (black) represents the median fold change between pools from non-malignant and malignant tissue related to the right y-axis scale. The arbitrary line at 1.5 represents the rough estimate of differential expression between non-malignant and malignant tissue, as explained in the text.

