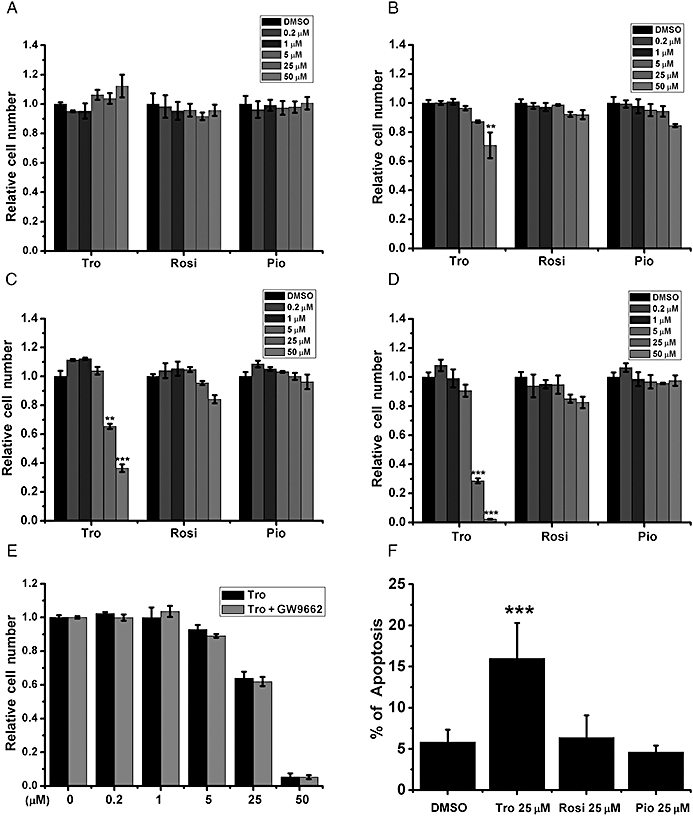
Figure 2.

Differential effects of glitazones on cell viability and apoptosis. (A–D) HepG2 cells cultured in (A) 10%, (B) 5%, (C) 2.5% and (D) 0.5% FBS were treated with different doses of Tro, Rosi and Pio for 24 h before cell viability measurement. (E) HepG2 cells in 2.5% FBS were pretreated with 1 µM of the PPARγ antagonist GW9662 for 2 h before Tro addition. The relative viabilities were measured and expressed as in (A). (F) The % of apoptotic cells were measured after 24 h drug treatments in HepG2 cells cultured in 2.5% FBS. (A–E) The relative level under dimethyl sulphoxide treatment was set as 1. *P < 0.05, **P < 0.01, ***P < 0.001.
