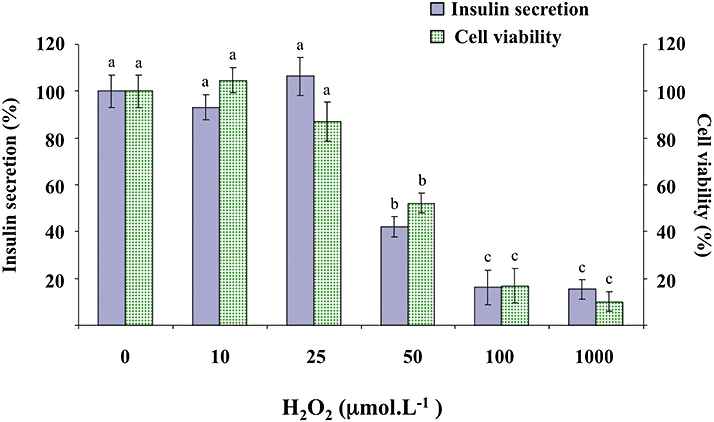
Figure 9.

Effects of H2O2 on glucose-induced insulin secretion and viability in INS-1 cells. INS-1 cells were incubated in the presence of glucose (8.3 mmol·L−1) and in the absence or presence of increasing concentrations (10–1000 µmol·L−1) of H2O2. Insulin secretion was quantified by the homogeneous time resolved fluorescence method. Viability was evaluated using the MTT assay. Data are expressed relative to the responses determined in the absence of H2O2, taken as 100%. Results are presented as mean ± SEM (n = 4–6 separate experiments). A multiple comparison analysis of data was performed for each type of experiment (insulin secretion or cell viability). Bars with the same letter do not differ significantly (P > 0.05).
