
Figure 2.
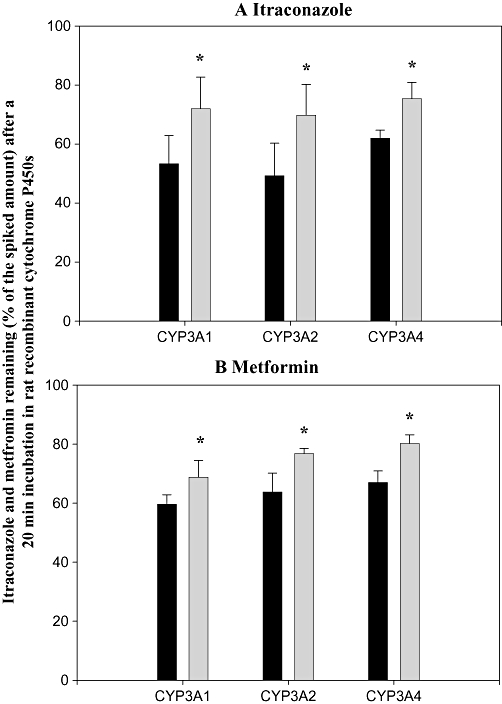
Mean quantities (expressed as a percentage of the amounts of drug added to the cells) of itraconazole (A) and metformin (B) remaining after a 20 min incubation in rat Baculovirus-infected insect cells expressing CYP3A1 and 3A2 and human Baculovirus-infected insect cells expressing CYP3A4 in the absence (solid columns) and presence (shaded columns) of 20 µM metformin (A), or itraconazole (B). Columns show means and bars represent SD. *Significantly different (P < 0.05) from the quantity remaining in the absence of metformin (A) or itraconazole (B).