
Figure 1.
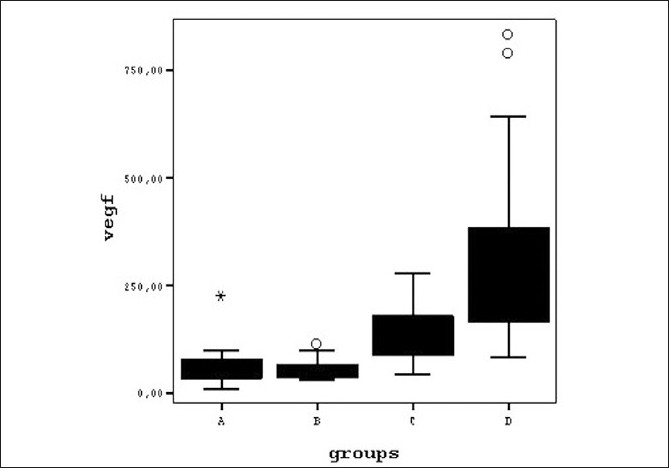
Diagram graphically displaying the differences between the aqueous VEGF levels of study groups on boxplots A = Control Group, B= NDR Group, C= NPDR Group, D= PDR Group
Official websites use .gov
A
.gov website belongs to an official
government organization in the United States.
Secure .gov websites use HTTPS
A lock (
) or https:// means you've safely
connected to the .gov website. Share sensitive
information only on official, secure websites.
Diagram graphically displaying the differences between the aqueous VEGF levels of study groups on boxplots A = Control Group, B= NDR Group, C= NPDR Group, D= PDR Group