
Fig. 3.
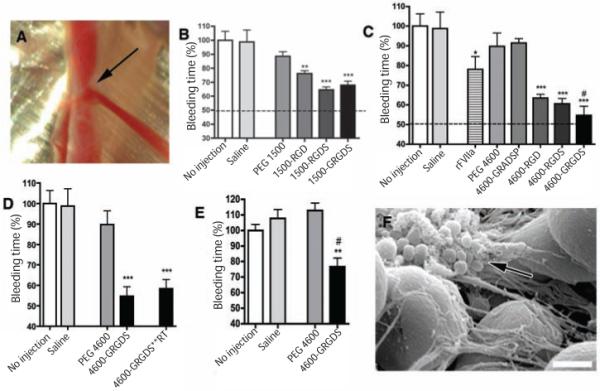
In vivo performance of synthetic platelets: hemostatic efficacy. (A) Femoral artery injury model used for all studies. Arrow, injury site and the blood spurting from the injured vessel. (B) Bleeding times following intravenous administration of PEG 1500 synthetic platelets at 20 mg/ml (n = 5). Data are presented as percentage of no injection mean value ± SEM. **P < 0.01 and ***P < 0.001 significant as compared to PEG 1500 alone. (C) Bleeding times after intravenous administration of PEG 4600 synthetic platelets at 20 mg/ml and rFVIIa at 100 ug/kg (n = 5). Data are presented as percentage of no injection mean value ± SEM. *P < 0.05 and ***P < 0.001 compared to saline, and # P< 0.05 compared to rFVIIa. (D) Bleeding times comparing synthetic platelet administration, PEG-4600-GRGDS, to synthetic platelets stored in a lyophilized state at room temperature for two weeks, 4600-GRGDS**RT (n=5). Data are presented as percentage of no injection mean value ± SEM. ***P < 0.001 compared to PEG 4600 alone. (E) Bleeding times when treatments were administered after injury. Bleeding times represented as a percentage of no injection bleeding time values (255 ± 12 seconds). Synthetic platelets were administered at 20 mg/ml. Data are presented as mean ± SEM (n = 5). **P < 0.01 compared to saline injection and # P < 0.01 compared to no injection. (F) SEM micrograph of clot excised from injured artery after synthetic platelet administration (4600-GRGDS). Synthetic platelets intimately associated with clot and connecting fibrin mesh (arrow) The large (5 μm) spheres are blood cells. Scale bar, 1 μm.