
Figure 2.
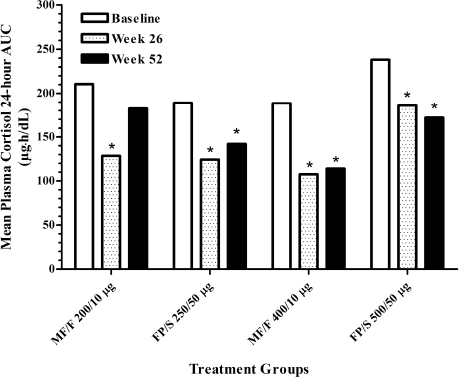
Mean plasma cortisol 24-hour AUC at baseline, week 26, and week 52. Patients who had both 0- and 24-hour measurements were included in the analysis. AUC, area under the curve; FP/S, fluticasone propionate/salmeterol; MF/F, mometasone furoate/formoterol.
*p < .043 versus baseline within treatment groups.