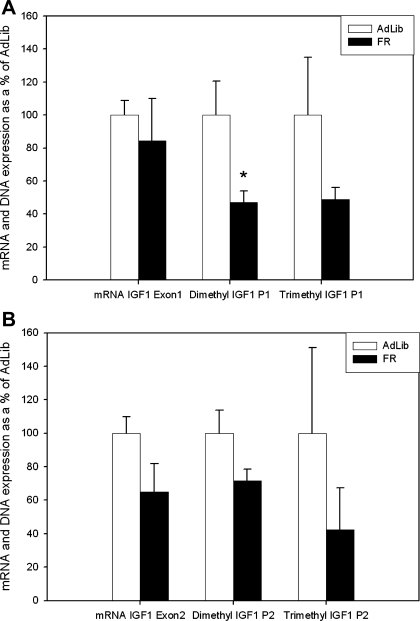
Fig. 2.
A: newborn IGF1 exon 1 mRNA expression and H3K4 dimethylation and trimethylation of promoter 1 (P1) on exon 1. Open bars represent AdLib, and solid bars represent FR; asterisk denotes differences between AdLib and FR newborns, P < 0.05. B: newborn IGF1 exon 2 mRNA expression and H3K4 dimethylation and trimethylation of H3K4 promoter 2 (P2) on exon 2. Open bars represent AdLib, and solid bars represent FR.

