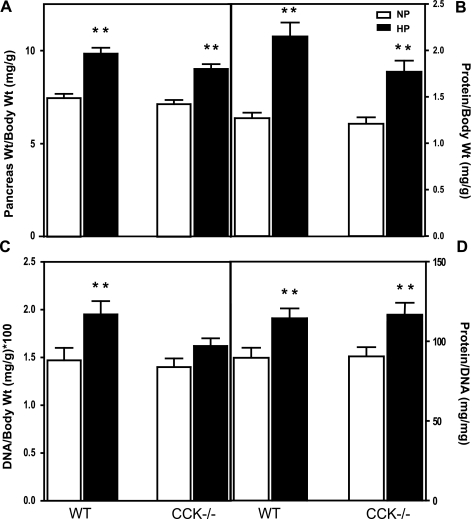
Fig. 1.
Effect of dietary protein on pancreatic growth in control and CCK-null mice. Changes in pancreas weight (A), protein content (B), DNA content (C), and protein-to-DNA ratio (D) after feeding normal-protein or high-protein chow for 7 days. NP, normal-protein 140 g/kg casein chow; HP, high-protein 750 g/kg casein chow; WT, C57Bl/6 mice; CCK−/−; homozygous CCK-null mice on C57Bl/6 background. Values represent means ± SE; n = 23–26 mice per group. Significantly different from respective 140 g/kg chow value, **P < 0.01 as determined by 2-way ANOVA.

