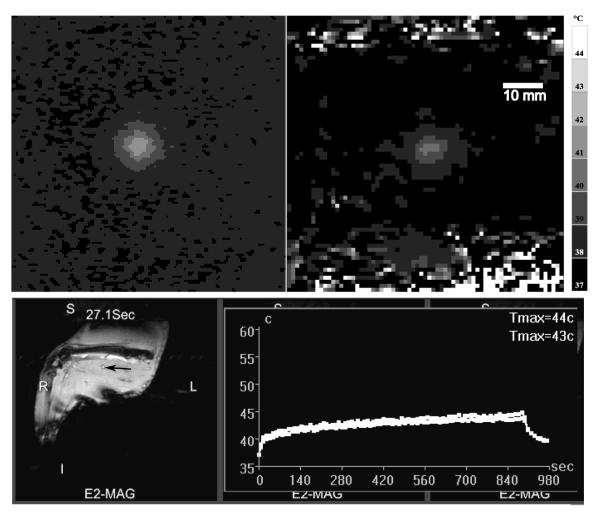
Figure 2.
Upper: Comparison between representative temperature maps following 100 pulses at 40 W acoustic power and 5 % duty cycle, 50 ms pulse width in tissue phantom (left) and rabbit thigh muscle (right). Lower: Temperature over time (right) collected in real-time during a standard pHIFU heating of a multiple focal spot (m = 9, N = 100, dc = 5 %) treatment zone in rabbit muscle. T2-weighted images were used to place the treatment spot (arrow, left image). Thermal maps are acquired centered on the region of treatment, and the peak temperature plotted in real time (right). These curves are the temperature evolution of the hottest voxel (upper, Tmax=44 °C) or a 9 voxel average centered on the hottest voxel (lower, Tmax=43 °C). Detailed image acquisition parameters are given in section 2.1.

