Figure.

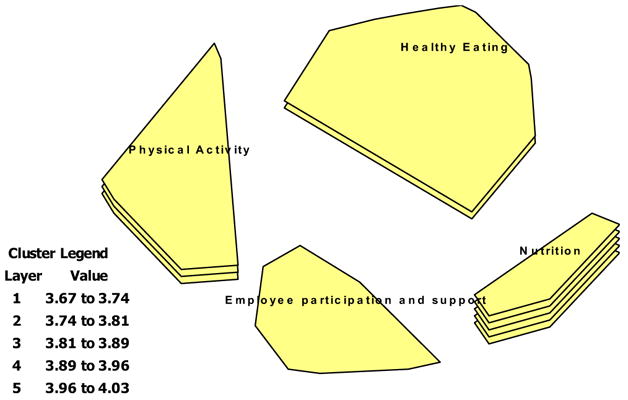
Concept map. Statistical summary from the sorting of all statements by each participant “in a way that makes sense to you,” and the rating of all statements by each participant on a five-point scale on the relative importance of each item to include in a workplace website about nutrition and exercise (1=Extremely Unimportant to 5=Extremely Important). Clusters with more layers were considered relatively more important. Spatial cluster size represents how frequently participants sorted statements in a given cluster together.
