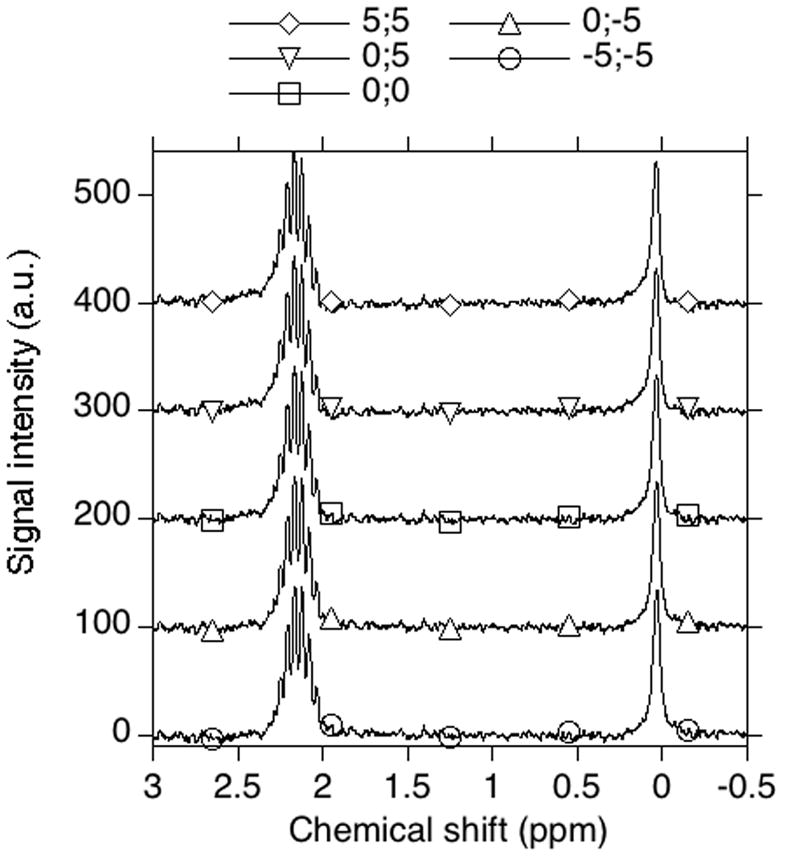
Fig. 4.

The effect of phasing on the peak shape in NMR spectra of tubes containing primary and secondary standards. The NMR spectrum of (MeO)3PO (4.15 mM, secondary standard in capillary) and NaH2PO4 (2.0 mM, primary standard in bulk) was recorded. The spectrum was processed several times with various phase settings. The values of right and left phases relative to optimal phasing are indicated by pairs of numbers separated by a semicolon (x;y). The optimal phasing is judged by the peak shape.
