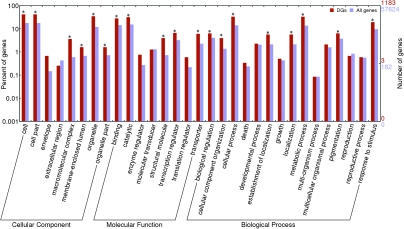
Figure 2.
Comparison of Gene Ontology (GO) Classification between Differentially Expressed Genes (DGs) and All Genes from the Rice Genome.
The gene ontology slims are from the Rice Genome Annotation (Ouyang et al., 2007). GO terms at level 2 are plotted. Star (*) indicates remarkable relationship, if the P-value is below the significant level of 0.05.

