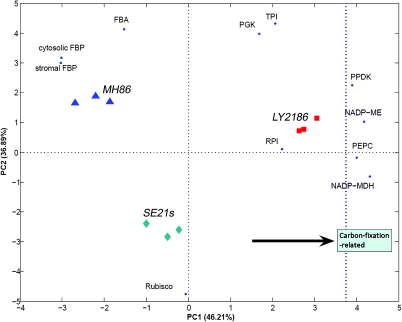
Figure 4.
Principal Component Analysis (PCA) of Enzyme Activity Patterns in LY2186 Combination.
BIPLOT visualization of PCA of enzyme activity patterns of the carbon-fixation pathway. The rice lines are indicated in red (LY2186), green (SE21s), or blue (MH86), and the contribution of the enzymes to positioning in the plot is provided. The two parent lines (MH86 and SE21s) are more similar to each other than either to the hybrid line (LY2186). The positioning of the hybrid line towards the right side of the plot (indicated by an arrow) underpins the increase in the carbon-fixation-related enzyme activity as compared with its parents.

