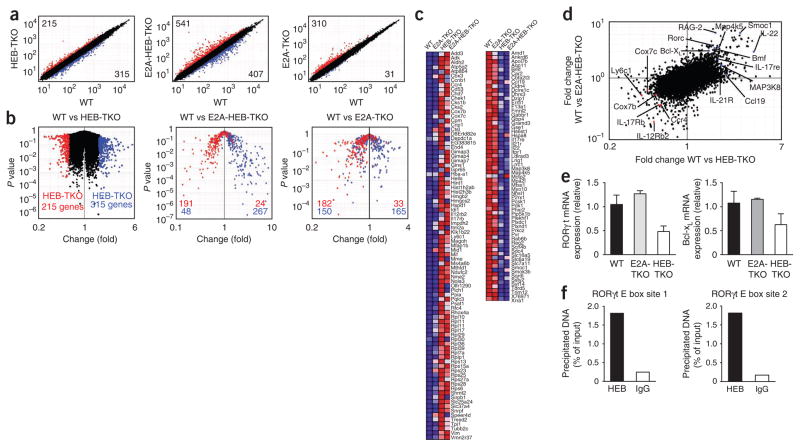
Figure 4.
Unique gene-expression profile of HEB-TKO DP cells. Affymetrix microarray analysis of mRNA from DP thymocytes sorted from wild-type, E2A-TKO, HEB-TKO and E2A-HEB-TKO mice. (a) Normalized expression values for wild-type versus HEB-TKO (left), E2A-HEB-TKO (middle) or E2A-TKO (right) DP thymocytes. Numbers in corners indicate number of genes with a difference in expression of 1.7-fold or more (upregulation, top left (red dots); downregulation, bottom right (blue dots)). (b) ‘Volcano’ plots of the gene-expression data of wild-type versus HEB-TKO (left), E2A-HEB-TKO (middle) or E2A-TKO (right) DP cells. Numbers in plots indicate genes with a difference in expression of 1.7-fold or more in HEB-TKO DP cells versus wild-type cells (upregulation, red; downregulation, blue). Data are representative of experiments with two or three data sets per group. (c) Annotated gene expression of transcripts with a difference in expression of 1.7-fold or more (upregulation, red; downregulation, blue). (d) Comparison of the gene-expression changes in wild-type versus E2A-HEB-TKO DP cells (horizontal axis) and wild-type versus E2A-HEB-TKO DP cells (vertical axis). Red and blue dots indicate transcripts uniquely up- and downregulated, respectively, by both HEB-TKO and E2A-HEB-TKO DP cells. (e) Expression of RORγt and Bcl-xL mRNA by E2A-TKO and HEB-TKO DP cells, normalized to the expression of GAPDH (glyceraldehyde phosphate dehydrogenase) and presented relative to their expression in wild-type cells. Data are representative of three experiments (average and s.e.m. of three or four individual samples). (f) Chromatin immunoprecipitation from wild-type thymocytes with antibody to HEB or control immunoglobulin G antibody (IgG), followed by quantitative PCR analysis of input or precipitated DNA containing RORγt E-box site 1 (left) or 2 (right).

