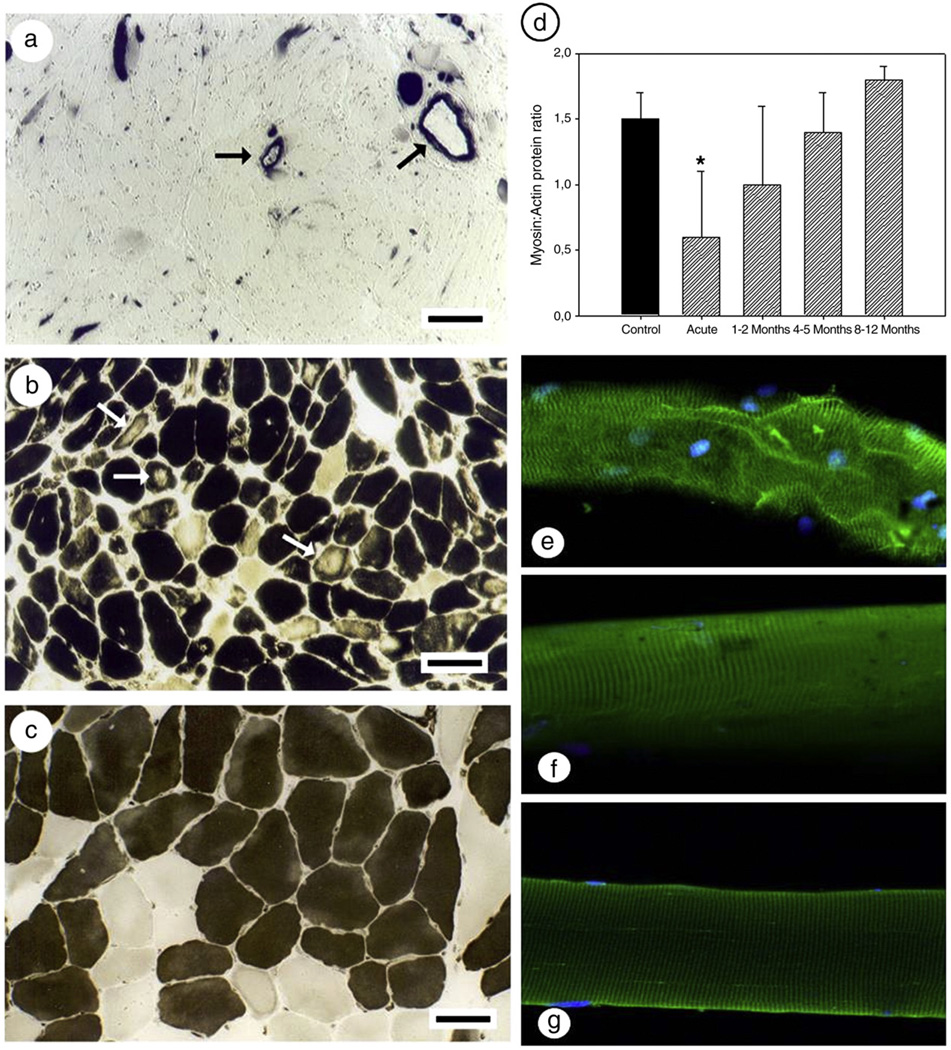
Fig. 1.
mATPase staining and myofibrillar protein expression during the acute phase of AQM and during recovery. (a–c) mATPase staining after acid preincubation (pH 4.6) in three different patients with AQM in the acute phase [7]. Arrows indicate the strong straining in the blood vessel walls (a) and regional loss of mATPase staining (b). A cross-section from a patient with a myosin:actin ratio corresponding to 0.6 with only minimal changes in the mATPase staining (c); the horizontal bars represent 100 µm. (d) Myosin:actin ratio as determined by 12% SDS-PAGE (Control = filled bar; AQM patients = hashed bar. Statistical significance versus controls is denoted by * (p<0.05); (e–g) single muscle fibers stained for myosin and myonuclei from the acute phase (e), 8 months recovery (f), and a control fiber (g; 40×).

