Figure 5.
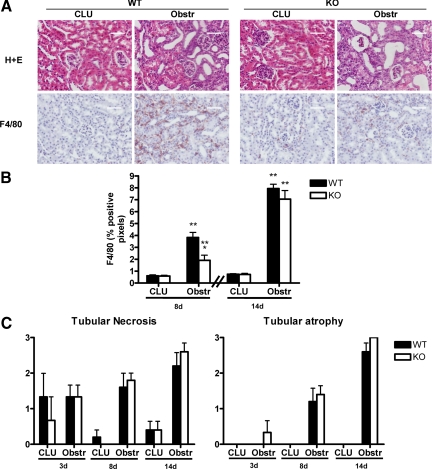
Characterization of histology and macrophage infiltration in Nogo-A/B KO kidneys in the UUO model. A: Top row, H+E stained sections taken from either the CLU or the obstr kidneys 8 days after UUO. WT and KO CLU kidneys were indistinguishable. After UUO, both showed signs of injury, including dilated tubules. Scale bar = 50 μm. Bottom row, Representative images of macrophage infiltration after 8 days using immunohistochemistry with anti-F4/80 antibody. Scale bar = 50 μm. B: Quantitation by digital image analysis of F4/80 positive staining. *P < 0.02 compared to WT obstr; **P < 0.05 compared to corresponding CLU; n = 5 in each group. C: H&E-stained sections were examined by a renal pathologist in a blinded fashion and scored on a 4-point scale (with “0” denoting no injury and “3” denoting severe injury). Although the severity of injury increased from 3 to 14 days, there was no significant difference between WT and KO kidneys. n = 3 at 3 days and n = 5 at 8 and 14 days.

