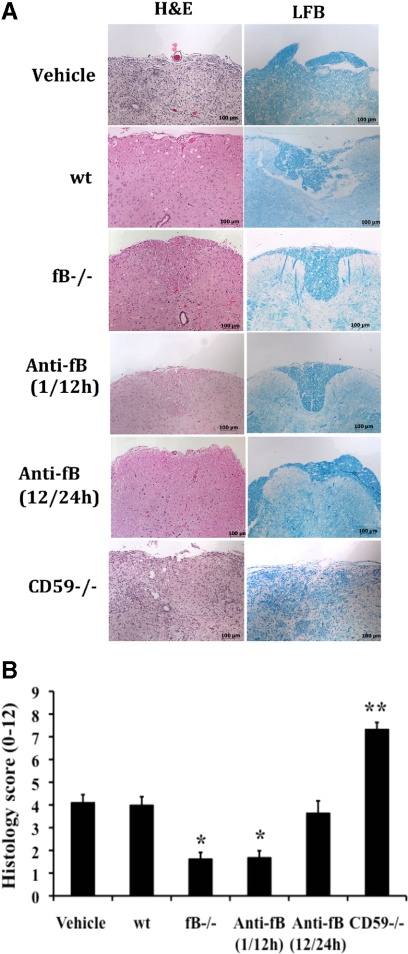
Figure 8.
Histopathology of spinal cord sections 21 days after injury. A: Images of transverse sections from spinal cords at the epicenter of injury. Sections stained with either H&E or LFB. Representative images, n = 6 per group. B: Quantitative assessment of histopathological inflammation, injury, and demyelination. H&E-stained sections were scored on a 0–3 scale for the presence and intensity of inflammatory cell infiltration, neuronal vacuolation, and hemorrhage. LFB-stained sections scored for demyelination (0 = no evidence, 3 = severe). Anti-fB mAb treatment groups received injections at 1 and 12, or 12 and 24 hours after injury. Vehicle control group (PBS) received injections at 1 and 12 hours after injury. Scores were then expressed as a cumulative score of 0–12. Mean ± SD, n = 6 per group. *P < 0.001 and **P < 0.0001 vs. vehicle control and wt.

