Figure 3.
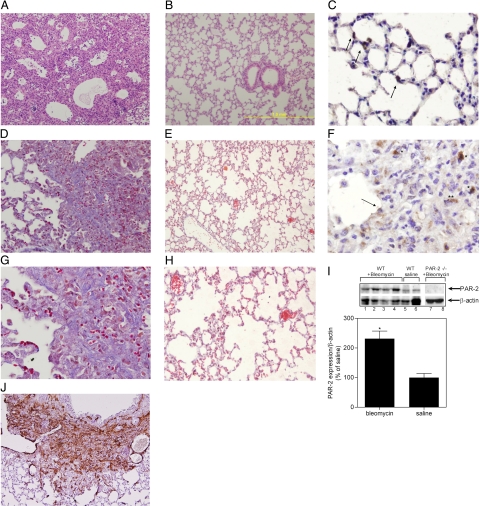
Bleomycin induces fibrosis and PAR-2 up-regulation in the lungs of wild-type mice. Lung tissue sections 14 days after bleomycin (A, D, F, G, and J) or saline (B, C, E, and H) administration. A and B: H&E (×100). C and F: PAR-2 staining of type 2 pneumocytes and in reactive epithelial cells at the advancing edge of fibrosis (arrow), mononuclear cells (Asterisk) and spindle-shaped cells in areas of fibrosis (Double Asterisks; C, ×400) and, in type II pneumocytes (arrows) of saline treated mice (F, ×400). D, E, G, and H: Masson’s trichrome staining [ ×200 (D and E) and ×400 (G and H); collagen in blue]. J: aSMA staining (×100). I, top: Representative Western blot analysis of PAR-2 expression in pulverized lungs of wild-type mice 14 days after bleomycin administration (lanes 1–4); wild-type mice treated with saline (lanes 5 and 6); and PAR-2−/− mice 14 days after bleomycin administration (lanes 7–8). β-actin serves as a loading control (bottom). Quantification of PAR-2 expression in wild-type mice 14 days after bleomycin or saline treatment. *P < 0.005 for bleomycin- versus saline-treated mice.

