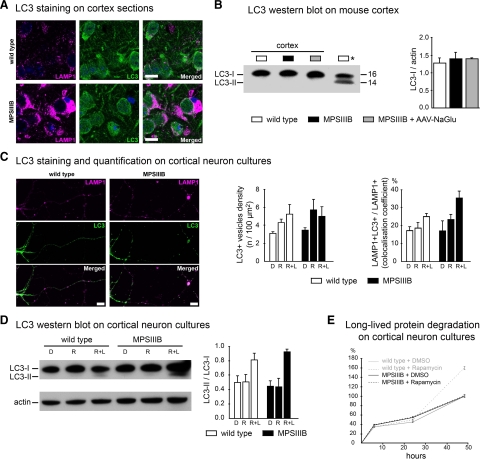
Figure 4.
Macroautophagy is not altered in MPSIIIB mouse cortical neurons. A: Parasagittal sections of the rostral cortex of 8-month-old wild-type or MPSIIIB mice were immunolabeled for LAMP1 (in purple) and LC3 (in green). Nuclei were counterstained in blue. Confocal views show intense LAMP1 staining of MPSIIIB sections and similar diffuse LC3 staining pattern in wild-type and MPSIIIB. Scale bars, 10 μm. B: LC3-I to LC3-II conversion was analyzed by Western blots. Proteins were extracted from the rostral cortex of 8-month-old wild-type mice, untreated MPSIIIB mice, or MPSIIIB mice treated by intracerebral injection of AAV-NaGlu vector (MPSIIIB+AAV-NaGlu). The diagram on the right shows equivalent LC3-I signal intensities with respect to actin signals (means ± SEM from three mice). LC3-II was not detected in cortical tissue extracts in contrast to a positive control (Asterisk) provided by wild-type mouse cortical neuron cultures treated with rapamycin (250 nmol/L) and leupeptin (50 μmol/L) for 48 hours. C: Cultures of wild-type or MPSIIIB cortical neurons were treated at day 6 with vehicle (DMSO: D), or rapamycin (250 nmol/L, R), or rapamycin (250 nmol/L) and leupeptin (50 μmol/L, R + L). Neurons were fixed at day 8 and immunolabeled for LAMP1 (in purple) and LC3 (in green). Apotome views of neurons treated with rapamycin and leupeptin show LC3-positive vesicles in wild-type and MPSIIIB neurites (middle row). Scoring of LC3-positive vesicles along neurites in basal conditions and after drug treatment did not show significant difference between wild-type and MPSIIIB neurons (left diagram, means ± SEM from three independent cultures; P > 0.1, t-test). LC3 and LAMP1 signals did not colocalize more frequently in MPSIIIB than in wild-type cultures whatever the treatment (right diagram, means ± SEM from three independent cultures; P > 0.1, t-test). Scale bars, 10 μm. D: Proteins extracted at day 8 from neuron cultures maintained in basal conditions (DMSO: D), or incubated with rapamycin (R), or with rapamycin and leupeptin (R + L) for days 6 to 8 were analyzed by Western blots to examine LC3-I to LC3-II conversion. Signal quantification shows equivalent LC3-II/LC3-I ratios for each condition in wild-type and MPSIIIB neurons (means ± SEM from three independent cultures). E: The degradation of long-lived proteins was examined by metabolic labeling of cultured neurons with 3H-leucine. Ratios of 3H counts in culture supernatant (corresponding to the amount of degraded proteins) to cell pellet (corresponding to the number of labeled cells) were determined at day 8 in wild-type (gray lines) or MPSIIIB (black lines) neurons cultures, either in basal conditions (DMSO) or after treatment with rapamycin (250 nmol/L) for 48 hours (means ± SEM from three independent cultures, P > 0.1 for all time-points, Mann–Whitney test).

