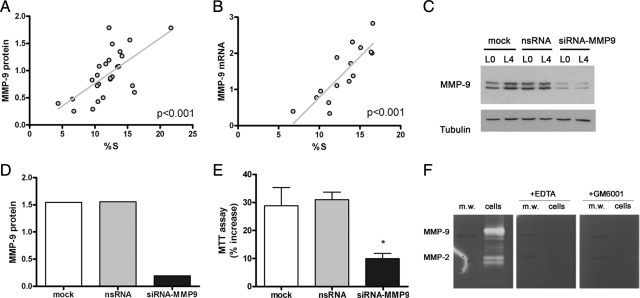
Figure 10.
MMP-9 expression in relation to cell division in macrophages. A and B: Macrophages were subjected to L-cell starvation for 18 hours and then incubated again with the conditioned medium from different time periods ranging from 6 to 24 hours. Then cells were harvested, and a part of the cells was used to study the cell cycle by flow cytometry and the other was used to study the expression on MMP-9 protein by Western blotting (antibody ab76003 from Abcam) (A) or RNA by real-time RT-PCR (B). A: The content of MMP-9 was significantly correlated with the percentage of cells in the S phase (linear regression analysis, P < 0.001). The MMP-9 band intensity in each lane of the Western blot was measured, and it was normalized by the corresponding band intensity of β-tubulin. Points in the graph correspond to single values and were obtained in four independent experiments. B: The MMP-9 RNA content was studied by real-time RT-PCR. Expression of MMP-9 RNA was positively correlated with the percentage of cells entering the cell cycle (linear regression analysis, P < 0.001). Points in the graph correspond to single values and were obtained in two independent experiments. C–E: MMP-9 expression was silenced with siRNA. Cells were exposed to either mock treatment, nsRNA, or siRNA against MMP-9 (siRNA-MMP9) for 1 day. After that, cells were subjected to L-cell starvation for 18 hours (L0) and incubated again with L-cell conditioned medium for 22 hours (L4). C: An image of a representative Western blot is shown. The experiment was repeated twice. D: Corresponding quantification of MMP-9 protein at stage L4 is shown to demonstrate that siRNA-MMP9 treatment effectively reduced MMP-9 expression. E: The percent increase in cell number from L0 to L4 was assessed with the MTT assay after the different treatments (n = 3 per treatment). Data of a representative experiment of two independent experiments are shown. One-way analysis of variance followed by the Bonferroni post hoc test showed a significant reduction of cell growth after silencing of MMP-9 expression. *P < 0.05. F: Gelatin zymography shows MMP-9 and MMP-2 activity in cell extracts of macrophages and the complete inhibitory effect of either the broad spectrum MMP inhibitor GM6001 (10 μmol/L) or EDTA (10 mmol/L) that was added to the incubation medium of the gels after electrophoresis. m.w., molecular weight.

