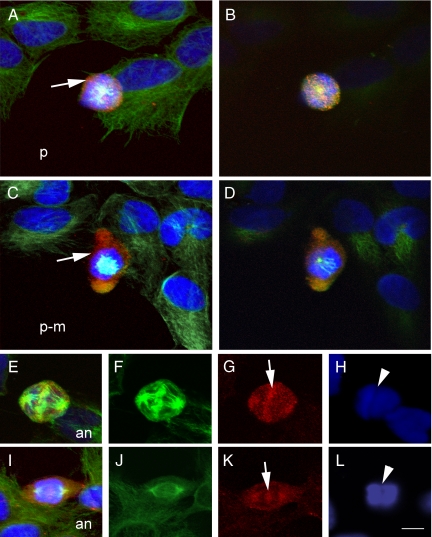
Figure 4.
Confocal microscopy images showing details of the subcellular location of MMP-9 immunoreactivity at certain mitotic phases. Staining with antibodies against MMP-9 (Chemicon International) (red) and β-tubulin (green) and Hoechst DNA staining (blue). A: Projection confocal image of a cell at prophase (p) surrounded by MMP-9-like immunoreactivity (arrow). B: Section (0.5-μm-thick) of the cell shown in A. The zone of microtubule (green) depolymerization for centrosome formation is in close proximity to MMP-9 immunoreactivity (red), as is shown by the yellow area in the center of the cell. C: Projection confocal image of a cell at late prophase-prometaphase (p-m), showing a thick wall of intense MMP-9 staining (arrow) surrounding the DNA (blue). D: Section (0.5-μm-thick) of the cell shown in C, showing the centrosome and forming a mitotic spindle (light blue) on the top of DNA (dark blue). E and I: Images of cells at anaphase (an) (merged image) are composed of corresponding single images of β-tubulin (F and J, green), MMP-9 immunoreactivity (G and K, red), and DNA (H and L, blue). E: Cell at anaphase showing that MMP-9 staining is in close proximity to the microtubules (yellow). F: Enlargement of the kinetocore microtubules located between the separating chromatids as marked in H with an arrowhead. At this stage, MMP-9 staining (arrow in G) is apparent between the separating chromatids (H). I: Cell at anaphase showing increased separation between the poles of the spindle, with acquisition of a fusiform shape and with MMP-9 staining at the migrating opposite poles of the cells. J shows microtubules and K shows MMP-9 staining (arrow) between the two separating chromatids (shown in L, arrowhead). Arrows point to MMP-9 staining and arrowheads point to DNA. Scale bar = 10 μm.

