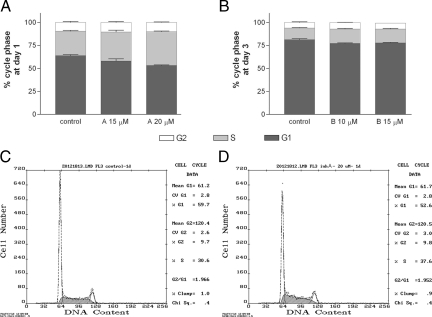
Figure 5.
MMP-9 inhibitors disturb the cell cycle. A: After 1 day of incubation in the presence or absence of inhibitor A, cells were labeled with propidium iodide, and the cell cycle was examined by flow cytometry. The percentage of cells in the S phase increases (P < 0.05 and P < 0.01 at the doses of 15 and 20 μmol/L, respectively) with the inhibitors in relation to the vehicle-treated control. The inhibitor also significantly reduces the percentage of cells in the G1 phase (P < 0.05 and P < 0.01 at the doses of 15 and 20 μmol/L, respectively). B: Likewise, the percentages of cells in the S phase (P < 0.001) and G2 phase (P < 0.05) increase, whereas that of cells in the G1 phase decreased (P < 0.001) after a 3-day exposure to inhibitor B at doses of 10 and 15 μmol/L. Data are expressed as the mean ± SEM (n = 6 to 4) percentage of cells in each cycle phase. Results were analyzed by one-way analysis of variance followed by Dunnett’s multiple comparison test to evaluate the effects of treatments against the control. Representative examples of the flow cytometry analysis are shown in C and D for a control and for 20 μmol/L inhibitor A, respectively.

