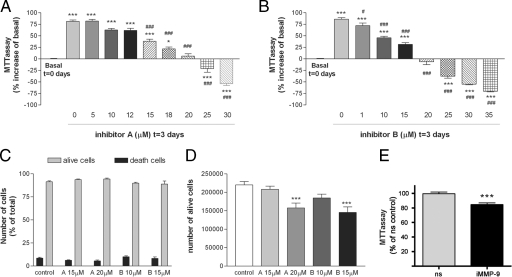
Figure 7.
MPP inhibitors reduce cell growth but only promote cell death at high doses after a 3-day exposure. Cells were exposed to the MMP inhibitors from day 0 to day 3, and then cell growth was assessed with the MTT assay. The MTT value was compared with the basal MTT at time 0. * and #, Comparison versus basal MTT at time 0 and control MTT at day 3, respectively. After 3 days in culture, MTT values increased in the controls by approximately 75% above basal (P < 0.001). A: From the concentration of 15 μmol/L, inhibitor A reduces the 3-day MTT value in relation to the control (0 μmol/L inhibitor; #). Increasing concentrations of inhibitor A progressively reduce the 3-day increase in relation to basal MTT (*). No increase above basal MTT is seen at 20 μmol/L, and a reduction below basal is seen from the concentration of 25 μmol/L. B: From the concentration of 1 μmol/L, inhibitor B reduces the 3-day MTT value in relation to the control (0 μmol/L inhibitor; #). Increasing concentrations of inhibitor B progressively reduce the 3-day increase in relation to basal MTT (*). No increase above basal MTT is seen at 20 μmol/L, and a reduction below basal is seen from the concentration of 25 μmol/L. Values in A and B are expressed as percentage of increase or reduction in relation to basal MTT at time 0 and are the mean ± SEM of n = 6 to 18 values per group obtained in two to three independent experiments. C: The mean ± SEM percentage of dead and living cells in relation to total cell number in the culture is not altered by 3-day exposure to MMP inhibitors (n = 8 values per group obtained in two independent experiments). D: In agreement with results of the MTT assay, the trypan blue dye exclusion assay shows that the absolute number of live cells per well (in a 12-well plate) is reduced (P < 0.001) after exposure to either 20 μmol/L inhibitor A or 15 μmol/L inhibitor B. Results were analyzed with one-way analysis of variance followed by Dunnett’s multiple comparison test to evaluate the effects of treatments against the control. E: SH-SY5Y neuroblastoma cells were transfected with either siRNA against MMP-9 (siRNA-MMP9) or with nsRNA. After 4 days, cell number was assessed with the MTT assay, and values are expressed as a percentage of nsRNA as the control. Statistical analysis with Student’s t-test showed a significant reduction in cell growth after silencing of MMP-9 (P < 0.001).

