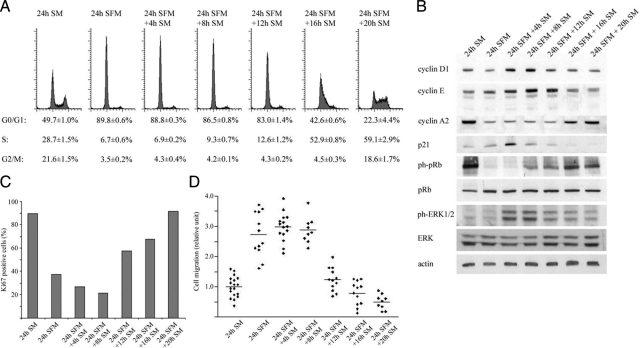
Figure 1.
Effect of cell phase on MDA-MD-231 cell cycle protein expression and migration. Cells were quiescent for 24 hours before serum stimulation and monitored at the indicated times for changes in cell phase distribution, cell-cycle related protein expression, and migration. Control is nonquiescent, actively cycling cells. Blots are representative, histograms and migration plots are averaged from at least three independent experiments. A: Cell phase analysis by flow cytometry. B: Cyclin D1, cyclin E, cyclin A2, p21, pRb, phospho-pRb, ERK1/2, and phospho-ERK1/2 expression by Western blot. C: Ki-67 expression analyzed by immunocytochemistry. D: Cell migration analyzed by Boyden chamber assay. Twenty-four hour SM vs. 24 hours SFM + 8 hours SM, P < 0.001 two-tailed Student’s t-test. SM, serum medium; SFM, serum-free medium.

