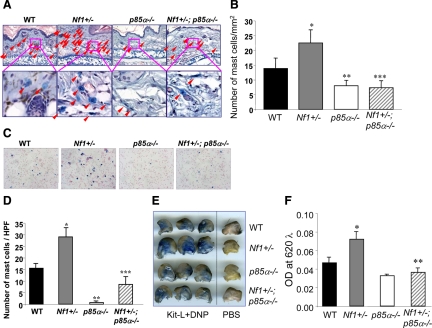
Figure 4.
Effect of genetic inactivation of p85α on mast cell numbers in vivo. A and B: Ear sections were stained with Alcian Blue, and mast cells were quantitated in a blinded fashion by counting 1-mm2 sections. Mast cells are identified by arrowheads. *P < 0.01 comparing Nf1+/− versus WT mice. **P < 0.01 for p85α−/− versus WT mice. ***P < 0.01 for Nf1+/− versus Nf1+/−;p85α−/− mice. C and D: Representative cytospins from peritoneal lavages stained for mast cells from individual mice of the four Nf1 and p85α genotypes. Peritoneal cells were stained with toluidine blue to quantify the total number of mast cells per peritoneal lavage. *P < 0.01 for Nf1+/− versus WT mice. **P < 0.01 for p85α−/− versus WT mice. ***P < 0.01 for Nf1+/− versus Nf1+/−;p85α−/− mice. E and F: Genetic disruption of p85α diminishes PCA in vivo. WT, Nf1+/−, p85α−/−, and Nf1+/−;p85α−/− mice were sensitized by intradermal injection of anti-DNP IgE (1:44 dilution, 1 μg/ml) into the right ear (20 μl/injection) and PBS (20 μl/injection) into the left ear. After 20 hours, mice were challenged by intravenous injection of antigen (DNP-HSA) and Kit-L along with Evans blue injection. Photographs of representative IgE-primed (left) and control (right) ears 20 minutes after antigen/Kit-L challenge are shown qualitatively. From each ear, Evans blue was extracted, and the intensity of the dye was measured by absorption at 620 nm. *P < 0.01 comparing Nf1+/− versus WT mice. **P < 0.01 for Nf1+/− versus Nf1+/−;p85α−/− mice.

