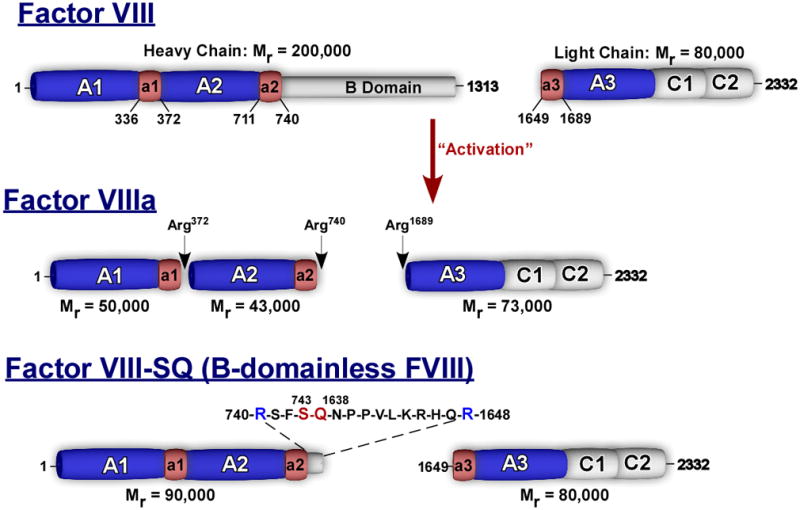
Fig. 1.

Schematic representation of factor (F)VIII, FVIIIa and FVIII-SQ. Boundaries of the acidic regions denoted by a1, a2, and a3 are indicated. ‘Activation’ represents thrombin-mediated proteolysis of FVIII and cleavage sites are indicated as well as the molecular weight of the various fragments. The ‘SQ-linker’ in rFVIII-SQ is given above the schematic.
