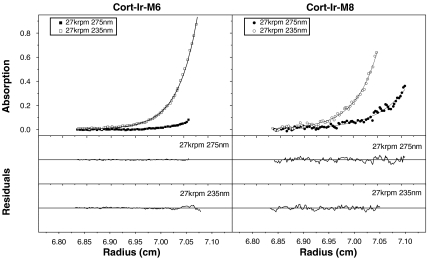
Fig. 3.
Analysis of the oligomerization state of Cort-Ir variants by sedimentation equilibrium AUC. The sequences of Cort-Ir-M6 and Cort-Ir-M8 are shown in Fig. 1C. (Upper) UV absorbance gradients as a function of the radial position (data points) and fits according to a single ideal species model (lines). (Lower) Residuals showing the difference between the experimental data and the theoretical model. The fitted values are listed in Table 1.

