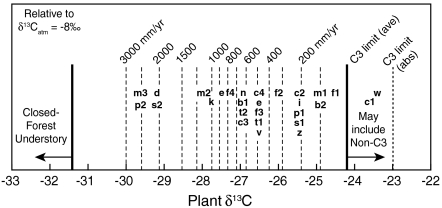
Fig. 3.
Paleodietary compositions corrected for altitude and latitude contoured for MAP; this plot permits interpretation of paleoenvironments from carbon isotope compositions of fossil tooth enamel or collagen. Tooth enamel and collagen compositions are averaged across species and corrected for δ13C of atmospheric CO2, physiological fractionations, altitude, and latitude. Most data plot at MAP ≤ 800 mm/yr, i.e., relatively dry environments, although wetter environments are also represented. b1 = Bibi (51); b2 = Bocherens and Drucker (63); c1 = Chritz et al. (30); c2, c3 = Coltrain et al. (32, 20–25 ka and 12 ka); c4 = Cerling et al. (2); d = DeSantis and Wallace (26); e = Eberle et al. (21); f1, f2 = Fox-Dobbs et al. (31, caribou, equid); f3 = France et al. (64); i = Iacumin et al. (65); k = Koch et al. (19); m1 = Morgan et al. (18 at 15.5 Ma); m2 = Merceron et al. (52); m3 = MacFadden and Higgins (20); n = Nelson (66); p1 = Passey et al. (49); p2 = Palmqvist et al. (27); s1 = Ségalen and Lee-Thorp (67); s2 = Secord et al. (25); t1 = Tütken et al. (68); t2 = Tütken et al. (69); v = van Dam and Reichart (34); w = Wang et al. (29); z = Zanazzi and Kohn (33).

