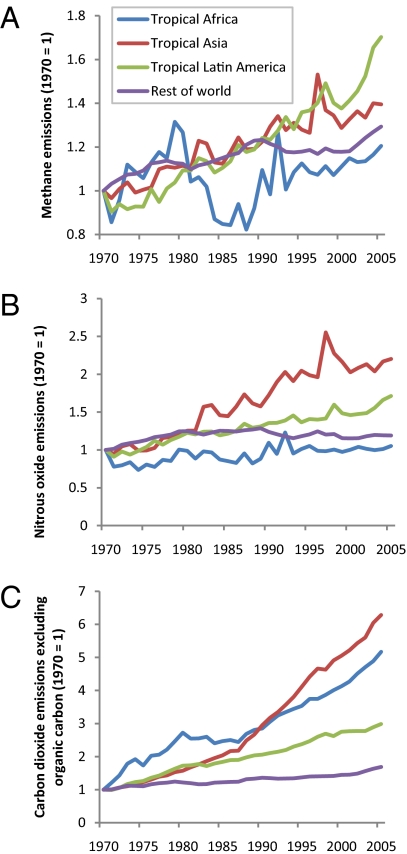
Fig. 1.
Changes in emissions of methane (A), nitrous oxide (B), and carbon dioxide (C) in tropics from 1970 to 2005 calculated from European Commission–Joint Research Center/Netherlands Environmental Assessment Agency (EC-JRC/PBL) (42). Values are normalized to 1970. Carbon dioxide is nonorganic sources only and does not include fires that have high interannual variability. See Table S1 for a list of countries included in each continent.

