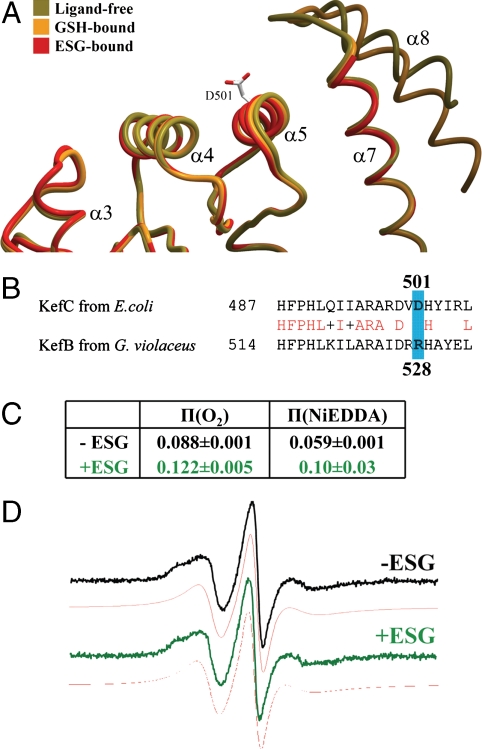
Fig. 5.
KTN conformational changes correspond with K+ flux regulation. (A) Most KTN domains associate with other elements of their system through a flat protein interaction interface formed largely by α-helices 4 and 5 (15–19). The helix-turn-helix arm of KefC (α 7/8) protrudes adjacent to this surface, preventing the formation of protein–protein contacts similar to those seen in other KTN structures. This obstruction is stabilized by the presence of GSH in the ligand pocket (orange). In contrast, on binding a glutathione adduct, the structure of this regulatory element becomes entirely disrupted, fully exposing the protein interaction interface (red). This frees the region to bind gating components of the transporter in order to initiate ion flow through the pore. The location of D501 in the center of this surface is illustrated. (B) Sequence alignment of KefC from E. coli and KefB from G. violaceus show conservation in the region of spin labeling while the mutated and labeled residue R528C itself (blue) is not conserved. (C) A substantial conformational change is indicated by the power saturation π-values of EPR spectra measurements that show an increased accessibility for oxygen and NiEDDA in the presence of ESG. (D) The EPR spectra in the absence (black) or presence (green) of 1 mM ESG and their respective simulations (red) indicate that the mobility of the spin label is not changed by ESG addition. Note that physiological concentrations of ESG fall in the 0.5–10 mM range (29).

