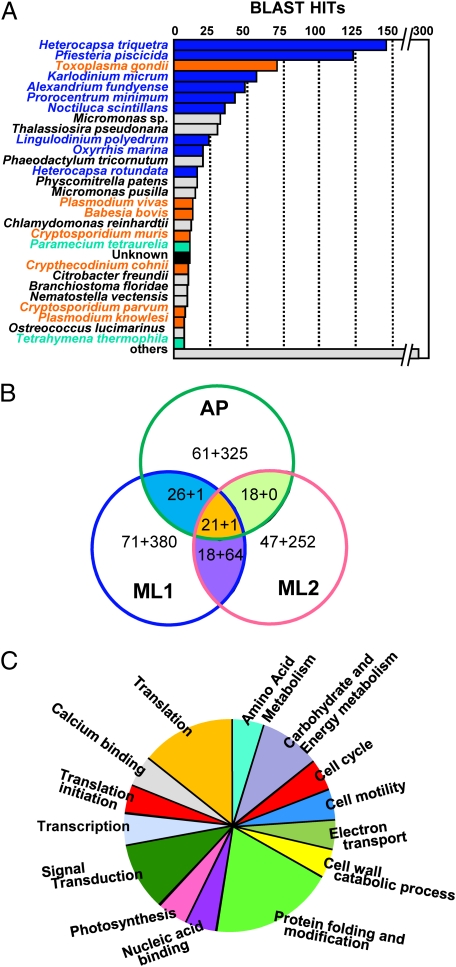
Fig. 1.
Taxonomic and functional distribution of the field-retrieved transcripts (e-cDNAs). (A) Taxonomic distribution of the e-cDNAs. The majority of the sequences either had no matches (others) or hit dinoflagellates (blue) or their alveolate relatives, apicomplexans (orange) and ciliates (green), and a small fraction hit unknown (black) or nondinoflagellate organisms (gray) with low similarities. (B) Number of common and unigene clusters in the three libraries. Numbers indicate annotated genes plus unknown genes. (C) Functional distribution of the 21 common annotated unigene clusters.

