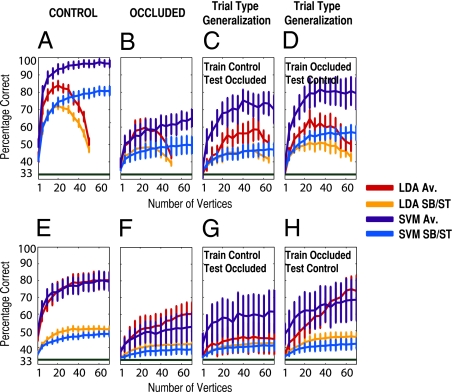
Fig. 2.
Pattern-classification analysis for experiments 1 and 2. (A–D) Classifier performance for experiment 1 (block design). A shows performance (percentage correct) for two linear classifiers, LDA and SVM, in decoding which scene was presented in control trials as a function of the number of vertices entering the classifier, for both average level (Av.) and single-block prediction (SB). Note that vertices are pooled across V1 and V2 in this analysis. Performance is averaged across participants (error bars represent one SEM). Chance performance is indicated by the dark green bar at 33%. B shows the same data for occluded trials. C and D show the results for the trial-type generalization analyses. E–H show classifier performance for experiment 2 (rapid-event–related design). E–H are arranged as in A–D but report performance for average (Av.) and single-trial (ST) prediction.

