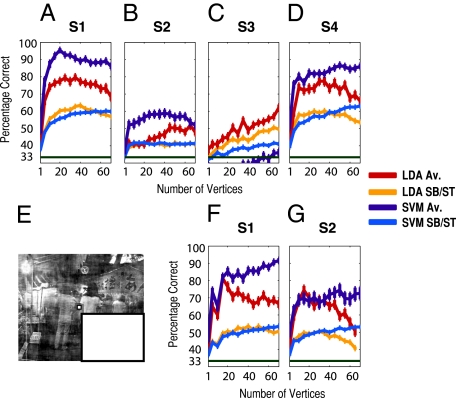
Fig. 4.
Pattern classification analysis for experiments 3 and 4. (A–D) Classifier performance per participant for experiment 3. A shows performance (percentage correct) for the two linear classifiers LDA and SVM in decoding which scene was presented in occluded trials as a function of the number of vertices entering the classifier, for both average level (Av.) and single-block prediction (SB), for subject 1. Note that vertices are pooled across V1 and V2 in this analysis. Performance is averaged across sampling iterations and cross-validation cycles (error bars represent one SEM). Chance performance is indicated by the dark green bar at 33%. B–D show the same information for the remaining participants in experiment 3. E shows an example of a scene stimulus shown in experiment 4 (SI Methods, “Low-Level Image Control”). F and G show performance data for the two participants who took part in experiment 4.

