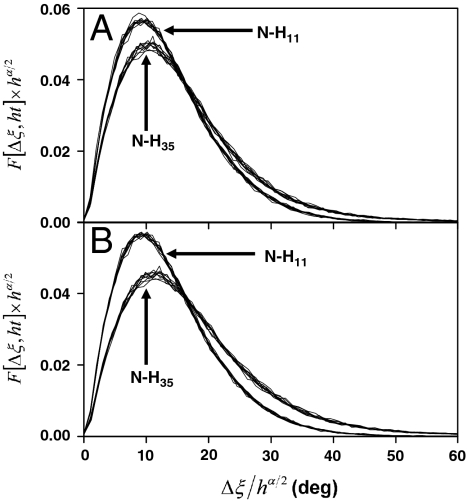
Fig. 2.
Typical results for the time evolution of the probability distribution function (PDF) of Δξn computed from the fluctuations of the (N-H)n bonds extracted from MD trajectories of VA3. Results are presented for (N-H)11 and (N-H)35 with a typical harmonic FEP (Fig. 1B, Inset) and multiple-minima FEP, respectively. The superposed curves are the PDFs computed from MD and rescaled by using Eq. 4 at times t = 10, 20, 30, 40, 50, 60, 70, 80, 90, 100, 300, 500, 600, 800, and 1,000 ps choosing h = 1 at t = 100 ps (A) and h = 1 at t = 1 ns (B). The PDFs are rescaled by using an exponent α ≠ 1 calculated from a fit to a SE of  up to 50 ps (A) and up to 1 ns (B). The PDFs cannot be distinguished at the scale of the figure.

