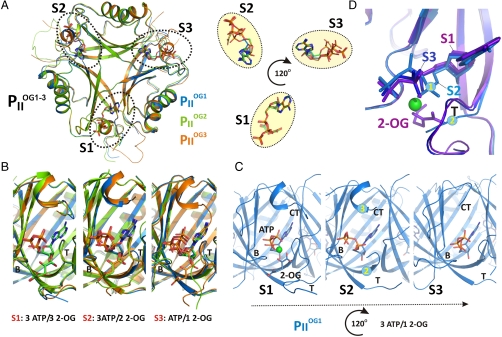
Fig. 3.
Anticooperativity of 2-OG–binding sites. (A) Top view of the  structure as a ribbon plot and superposition of the
  (in blue),
  (in green), and
  (in orange) structures. The three ATP/2-OG–binding sites are marked by dashed circles and numbered (S1, S2, and S3). The picture on the right represents the cofactors bound in the individual sites (highlighted in yellow) with three ATP and 2-OG molecules in S1, three ATP and two 2-OG molecules in S2, and three ATP and one 2-OG molecules located in S3, respectively. The clockwise consecutive 120° binding into S1 → S2 → S3 sites is shown by an arrow. (B) Zoom in (side view) of the three binding sites after superposition of the molecules. The content of the individual binding sites is marked below the picture. T and B loops are marked with T and B, respectively, for clarity. (C) Binding sites S1, S2, and S3 of the
  structure. In the S1 site, ATP, 2-OG, and Mg2+ (green sphere) are bound, whereas S2 and S3 contain only ATP and no Mg2+. Significant changes in the C terminus and the T loop in site S2 are marked with numbered circles. (D) Superposition of effector molecules bound to sites S1, S2, and S3 in the
  structure. The ATP molecule observed in the S2 site is significantly distorted relative to that in S1 and S3.

