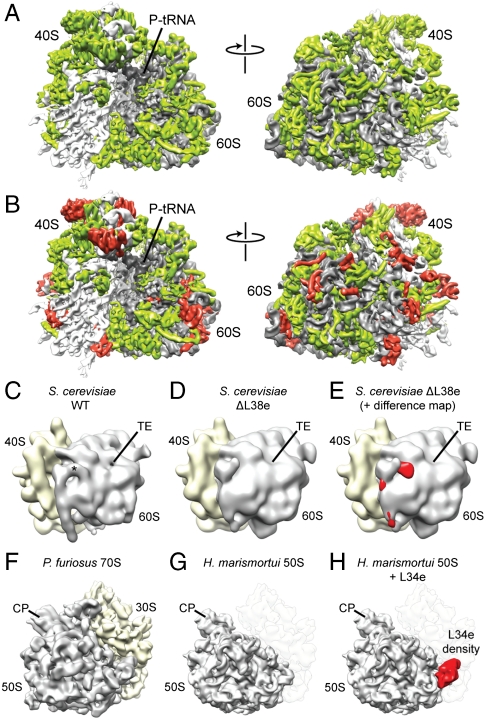
Fig. 1.
Identification of r-proteins L38e and L34e. (A) Cryo-EM map of the T. aestivum 80S ribosome, with rRNA colored gray and r protein colored green. (B) Same as A, but with localized r proteins colored red. Reconstruction of (C) S. cerevisiae WT 80S ribosome compared to (D) reconstruction of S. cerevisiae 80S ribosomes isolated from a strain lacking the gene for L38e. The asterisk indicates the position of additional density assigned to L38e, and the tunnel exit (TE) is shown for reference. (E) Difference density map calculated between C and D and shown superimposed on the map from D. Reconstruction of (F) P. furiosus 70S ribosome, compared to (G) X-ray structure of the 50S subunit from H. marismortui filtered to a similar resolution. (H) Difference density map calculated between F and G and shown superimposed on the map from G identifying the location of r-protein L34e (red).

