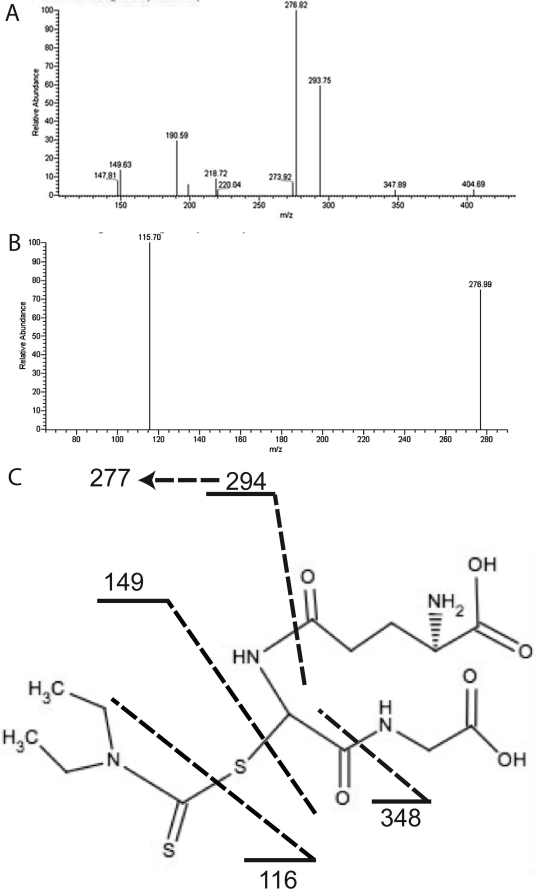
Fig. 5.
LC-MS/MS analysis of the DDC-GSH conjugate formed during metabolism by reconstituted CYP2E1. A, MS2 spectrum of the DDC-GSH conjugate eluting at 14.34 min with an m/z of 423. B, MS3 spectrum from the 276 fragment. C, the proposed structure of the DDC-GSH conjugate and the dashed lines are the sites of fragmentation as described in the text.

